Thorough explanation of how to measure and improve Webflow site performance

Even though the design of the site created with Webflow is perfect, the display is slow and users quickly leave — don't you have that kind of trouble? According to research, it is said that more than half of users leave when a page takes 3 seconds or more to load. There is no point in taking measures to attract customers if opportunities are lost due to slow display speed. In this article, I'll explain in detail the tools to accurately measure Webflow site performance and specific improvement steps.
Master tools to measure performance
In order to proceed with improvements, it is important to first accurately grasp the current situation. There are several free and reliable tools for measuring Webflow site performance. Since the granularity of the information obtained varies depending on the tool, it is recommended to use it properly according to the purpose.
Google PageSpeed Insights
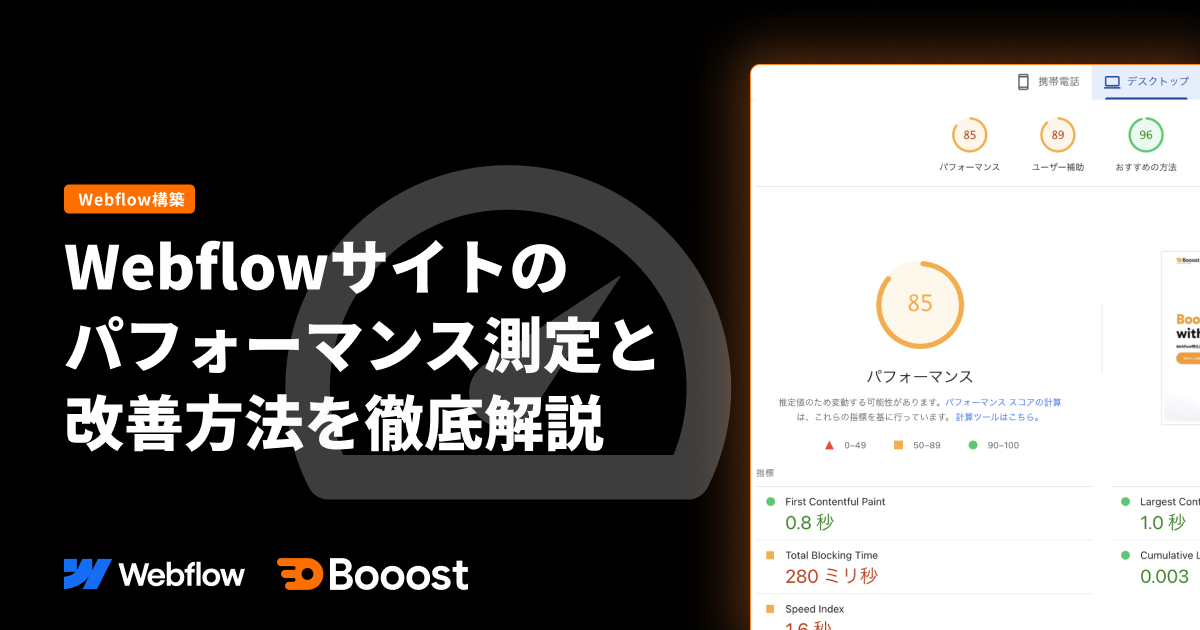
One of the most commonly used tools is Google PageSpeed Insights. By simply entering the URL, mobile and desktop scores are displayed, and improvements are also presented in detail. The score is shown as a number between 0 and 100, and 90 or higher is an indication of “good.” If you're measuring performance for the first time, starting here will help you get the full picture. Since the priority of improvement is displayed as “opportunities (improvement opportunities),” it is easier to determine what to start with.

[Image] Screenshot Results screen after entering the URL of the Webflow site into Google PageSpeed Insights (where you can see a list of scores and improvement items)
Google Lighthouse
Google Lighthouse, which is built into the Chrome developer tools, works with the same engine as PageSpeed Insights, and allows for more detailed analysis. Since it can be executed directly in the browser, it is also possible to measure performance on pages and in specific states after login. In addition to performance, it is rated in 4 categories: accessibility, best practices, and SEO, so it also helps improve the overall quality of the site.
WebPageTest
If more detailed analysis is required, WebPageTest is useful. Since it is possible to specify the region (Tokyo, United States, Europe, etc.) and communication speed (4G, cable, etc.) of the server that will perform the test, you can grasp the performance in a specific user environment. You can also check a waterfall chart (the order in which each resource was loaded and how long it took) to help you identify which files are bottlenecks.
Understand key performance metrics
If you don't understand the meaning of the metrics shown by measurement tools, you may misunderstand the direction of improvement. In particular, let's keep a focus on the 3 Core Web Vitals indicators that Google places importance on.
LCP (Largest Contentful Paint)is the time it takes for the largest image or block of text on the page to appear. 2.5 seconds or less is judged to be “good,” and if it exceeds 4 seconds, it is judged as “in need of improvement.” In many cases, the main visual image size and font loading will affect the LCP.
INP (Interaction to Next Paint) is an index that measures the time it takes for a browser to visually respond to user actions such as clicks and taps. The target value is within 200 ms. This is an indicator that tends to deteriorate when JavaScript processing is heavy.
CLS (Preferred Layout Shift) is a quantification of the amount of elements that are unexpectedly misaligned during page load, and 0.1 or less is considered “good.” The main causes are slow loading of fonts and unspecified image sizes.

[Image] Screenshot Google PageSpeed Insights results screen where the 3 indicators (LCP, FID, CLS) of Core Web Vitals are evaluated in green, yellow, and red
In addition to theseTTFB (Time to First Byte) It's also a good idea to check it out. The approximate time it takes for the server to return the first byte is within 800 ms. Since WebFlow's hosting uses a CDN, TTFB is rarely a major issue, but it's worth understanding as a measurement standard.
Also, checking whether Minification or Gzip compression is turned on in the Webflow settings before publishing is the first step in improving the score.
Specific methods for improving Webflow site performance
Let's implement improvement measures based on the measurement results. There are several factors that affect the performance of a Webflow site, but I will introduce them in order, starting with the most effective countermeasures.
Start by optimizing images
The most common cause of poor performance is large image files. Webflow is equipped with an automatic image optimization function, and uploaded images are automatically optimized and distributed via CDN. In addition to this, let's actively utilize the WebP format as an image format. Compared to JPG and PNG, WebP has a file size of about 20 to 30% smaller, and image quality is almost maintained. It is effective to use the WebP conversion tool in the WebFlow asset panel or convert with a tool such as Squoosh before uploading. Also, it is important to use a resolution that matches the display size for the images to be placed on the page. If you use a 3000px wide file for an image displayed at 800px width, useless data transfer will occur. As a way to reduce the amount of CSS loading,CSS output function for each pageUtilizing it is also an effective means.

[Image] Screenshot Operation screen using the WebP conversion tool on the WebFlow asset panel
Set Lazy Load
By setting “delayed loading” to load images and videos outside the screen when the user scrolls and approaches, the initial display load can be drastically reduced. In Webflow, you can enable “lazy load” from the image element settings panel. Note that the LCP improvement point is that lazy loading is not applied to the first view (area visible without scrolling) images.
However, background images (Background Images) are not covered by Webflow's lazy loading function. If you want to use large background images while considering performance, consider replacing them with an img element or compressing the image file size as much as possible.
Optimize font loading
While web fonts improve design quality, they can take a while to load. There are two main countermeasures that can be taken by optimizing fonts.
The first is to narrow down the font weights (Regular, Bold, Light, etc.) you use to only what you need. Reading all weights can lead to unnecessary file size increases.
The second is to set the font display setting to “Swap”. Since the system font is displayed as an alternative until the web font is loaded, text is displayed immediately and layout disturbances can also be prevented.
Review 3rd party scripts
Third-party scripts, such as Google Analytics, Chatbot tools, and ad tags, each add a load to page load. Focus on the tools you really need, and consider removing the ones you don't need or switching to lightweight alternatives. Regular inventory is recommended, especially if multiple scripts have been added to the custom code section.

[Image] Screenshot Webflow's Custom Code settings screen (Head Code and Body Code sections)
summary
The basic way to improve the performance of a Webflow site is to grasp the current situation with a measurement tool and prioritize improvements based on Core Web Vitals numbers. By simply starting with image optimization and lazy loading settings, you can get significant improvements on many sites. Performance improvements don't just happen once, and it's important to keep checking back as content is added or functionality is extended. Maintaining a site that is comfortable for users also leads to an increase in conversion rates. If you want to improve your SEO score at the same time,Webflow SEO Control Enhancement FeaturesPlease also refer to it. Make regular measurement and improvement cycles a habit.
Booost is a web development service specializing in the no-code tool "Webflow."
We maximize your website's customer acquisition power through three optimizations: design, marketing, and translation.

